Business Process Analysis
Understanding what people were actually doing rather than simply reproducing the existing spreadsheet.
Case Study · Business Process Automation
Turning a recurring manual estimate into a rules-based business system
Business Process Automation · Systems Integration · Forecasting Logic · Operational Reporting
At Sustainable Staffing, every Thursday we needed to forecast what the following week's client billing would look like.
The process sounded simple enough. We maintained a spreadsheet listing our clients and their Account Managers. Each Account Manager was expected to estimate the following week's billing for their accounts. Those estimates would then be reviewed against current payroll and billing information to understand what we expected from one week to the next.
In practice, producing those numbers required considerably more work than entering an estimate into a spreadsheet.
Someone had to determine who was currently working at each client, how many hours each employee was expected to work, whether their schedule differed from the standard shift, whether the client would be closed for a holiday or other reason, and whether an employee had reported time off that would reduce the expected hours.
The advance preparation frequently didn't happen. What was intended to be a quick 15-minute review became a 60- to 90-minute working meeting involving Branch Managers, our Director of Finance, and me while we assembled and calculated the forecast in real time.
There had to be a better way.
I didn't begin by building a web application.
The first step was understanding what people were actually doing to arrive at the forecast.
Zenople contained much of the information we needed, but producing a forecast still meant pulling reports, moving data into spreadsheets, comparing assignments and hours, and applying a collection of business rules that existed largely in the knowledge of the people doing the work.
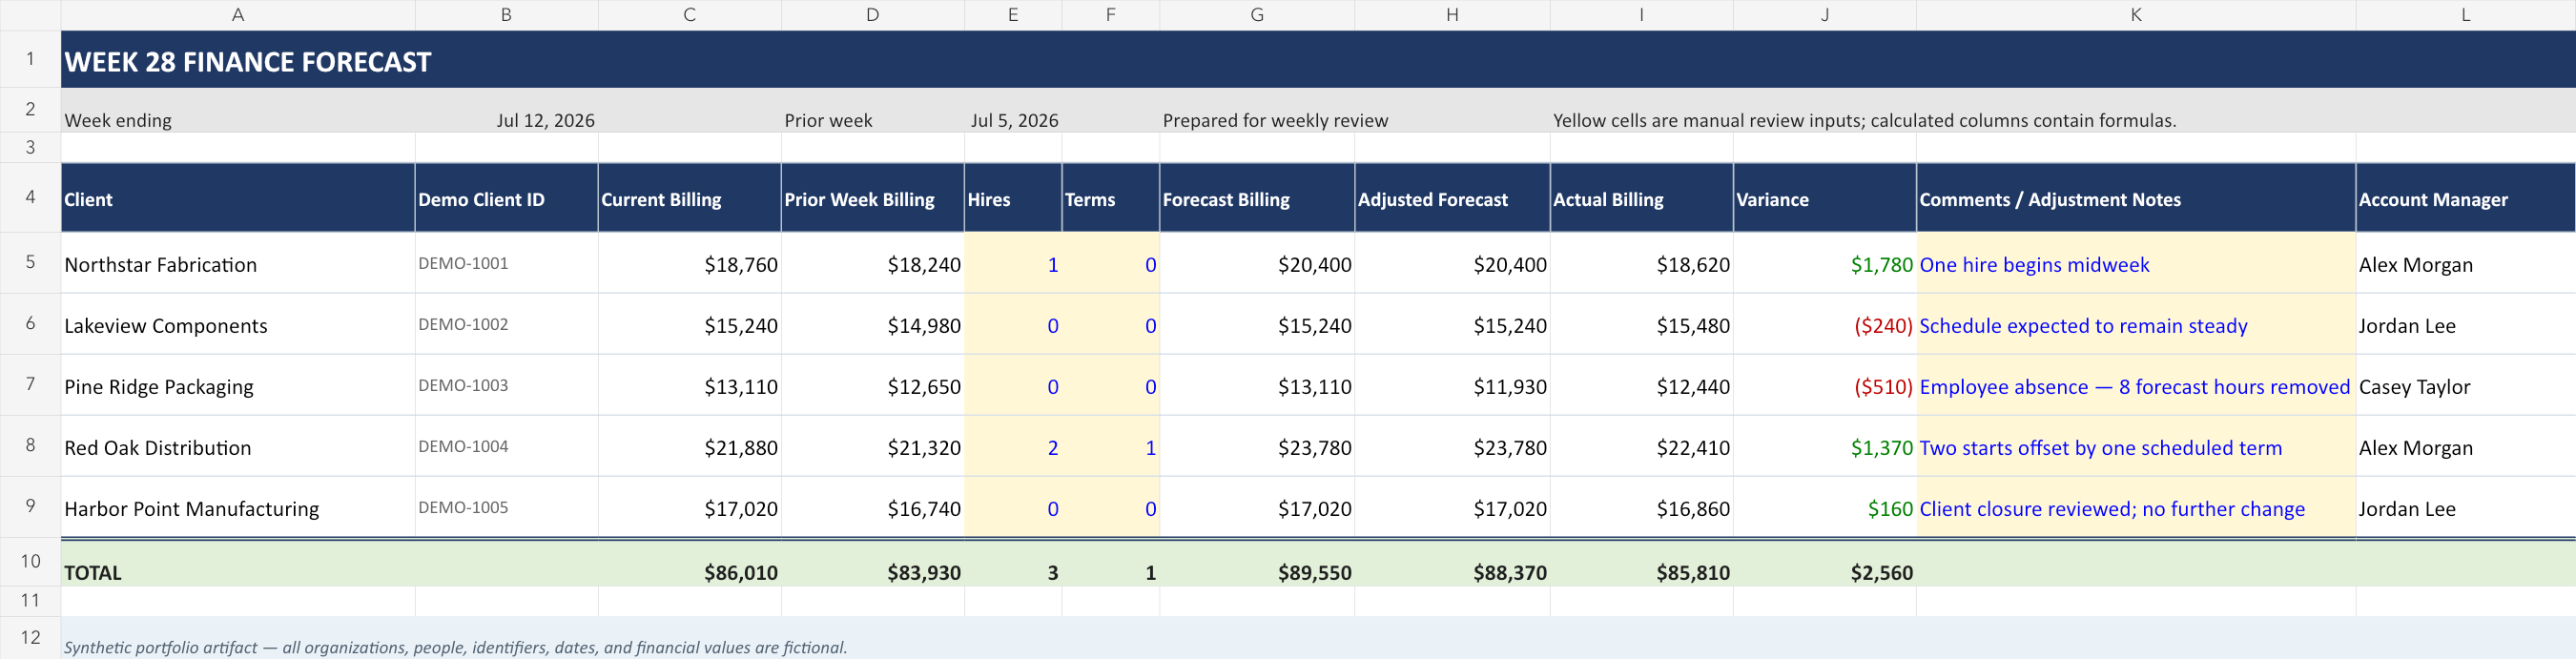
I expanded the existing forecasting spreadsheet with additional worksheets and formulas that could take the Zenople reports and generate more of the numbers we needed automatically.
That spreadsheet became an important intermediate step. It allowed the calculation logic to become explicit before the process moved into a database-backed application.
Representative reconstruction · Synthetic data
The obvious next step would normally have been an API integration.
That wasn't available to us.
Our Zenople environment was provided through another organization that supported multiple clients within the same system. A direct API connection could potentially expose data outside the Sustainable Staffing information we owned, making a conventional integration inappropriate.
But Zenople could deliver subscribed reports by email.
That became the integration boundary.
I configured the required reports to be delivered to a dedicated Google mailbox, used mailbox rules to identify and organize them, and used Google Apps Script to process the incoming files and hand them off for database import.
The important point is that the reporting/email mechanism became a deliberate systems-integration boundary when a conventional API path was not appropriate.
System architecture · Generalized workflow
Getting the data into a database was only part of the problem.
A useful forecast needed to understand what that data meant.
An active assignment didn't necessarily mean 40 billable hours next week. Employees worked different schedules. Some shifts included unpaid breaks. Assignments could begin or end during the forecast period. Clients could be closed for holidays or other reasons. Shift differentials could change billing rates. Hours beyond 40 needed to be calculated differently.
I progressively moved those rules out of people's heads and spreadsheets and into structured data and application logic.
The archived implementation directly confirms that the forecast calculation handled:
This was no longer a spreadsheet with formulas. It was becoming a model of how the business actually operated.
Representative reconstruction · Synthetic data
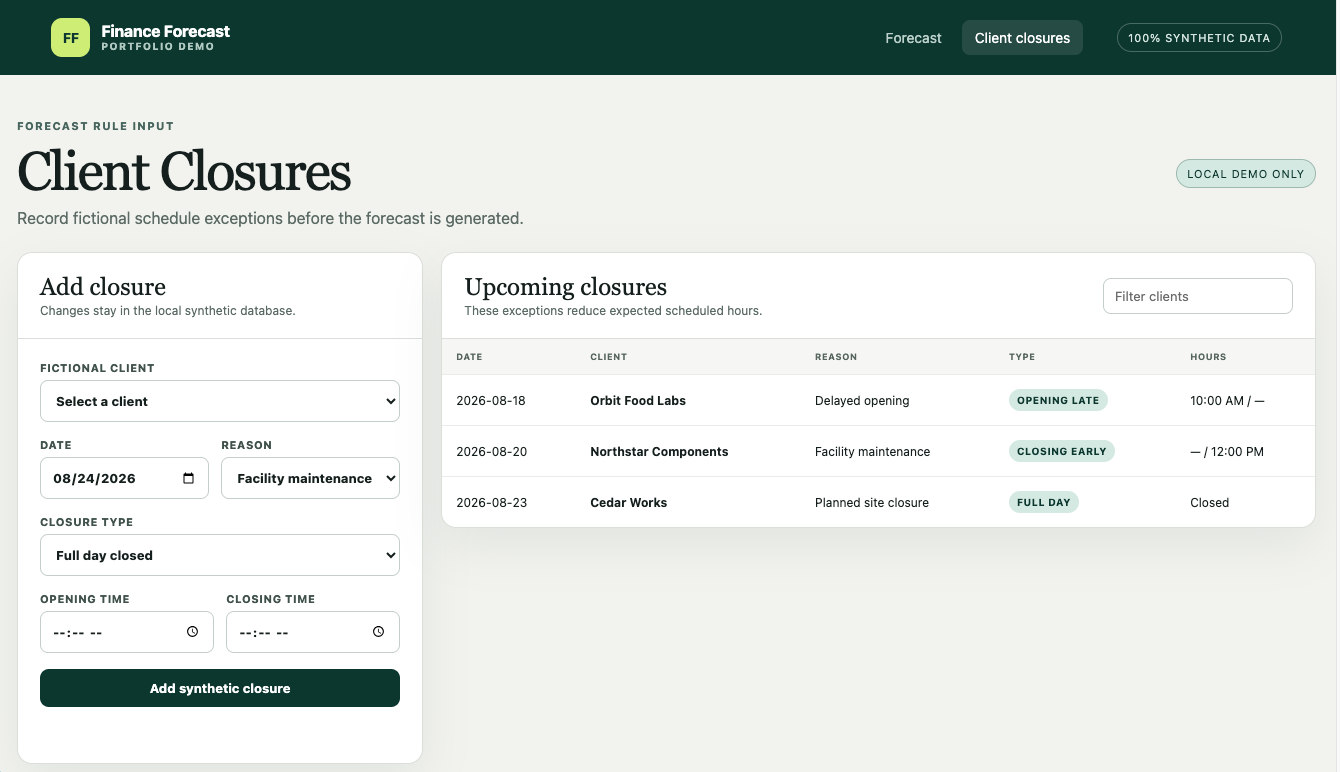
The application brought two related views together.
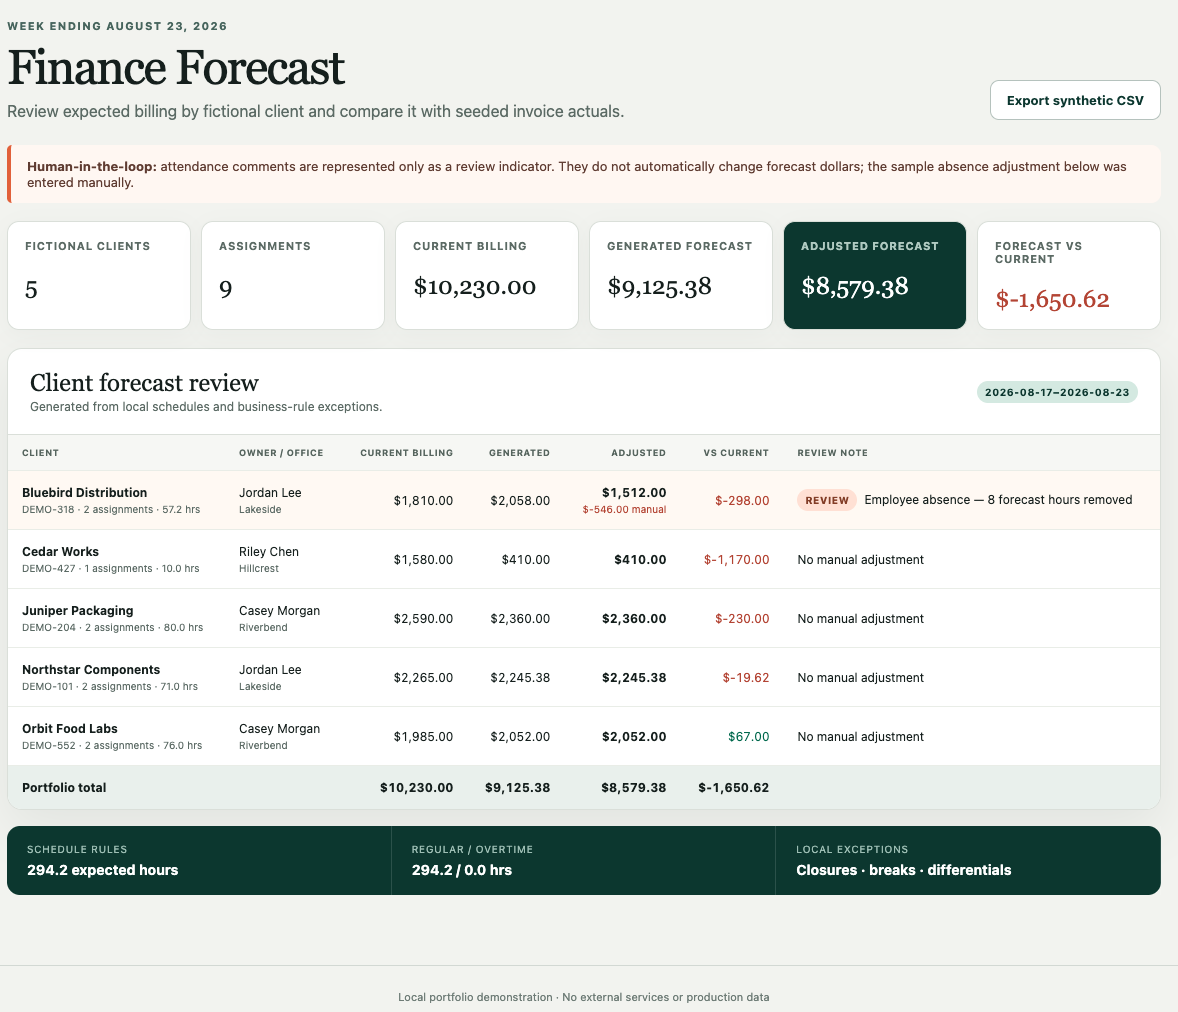
Actual billing could be derived from invoice data and associated with the appropriate client and billing department.
Forecast billing could be calculated from the employees actively assigned to those clients and the hours and rates they were expected to work.
That gave Finance a consistent way to compare what had happened with what we expected to happen next.
More importantly, the system could do the repetitive work before anyone sat down to review it.
The original process depended on people preparing estimates ahead of a meeting.
The new process generated the baseline forecast from the operational data itself.
One piece remained manual.
Employee absence comments were already being ingested and parsed into structured information. The archived implementation confirms that recent absence-related comments could be associated with active assignments and surfaced as a client-level attendance-review indicator.
What the system did not yet do automatically was convert that absence information into the resulting hours and billing reduction applied to the client's forecast.
By the final implementation, I spent approximately 10–15 minutes on Fridays reviewing those attendance exceptions, calculating the missed hours against the applicable billing rate, and adjusting the affected client forecast.
Because the comments were largely structured, I had identified the remaining step: use the parsed attendance information to calculate the forecast adjustment automatically.
The manual exception had been isolated.
Instead of people manually constructing the entire forecast, one remaining category of information still required human interpretation.
There was another discovery during implementation.
The ATS information we had originally been working with on Thursday became more complete on Friday.
Under the old process, waiting until Friday wouldn't have helped much because there was still too much manual work required to assemble the forecast.
Automation changed that equation.
With ingestion, assignment processing, schedule calculations, closure handling, and forecast generation already being performed by the system, waiting for the more complete Friday data no longer created a significant workload.
Our Director of Finance could open the application on Friday and have the forecast information available directly.
The recurring meeting that had once consumed 60–90 minutes of several people's time was no longer necessary simply to produce the numbers.
Representative reconstruction · Synthetic data
Once assignment, billing, and profitability information existed in a structured system, it became useful for more than the original weekly forecast.
The same underlying information could help expose accounts where existing contract economics deserved attention.
Rather than discovering a profitability problem after continuing under unfavorable terms, the broader finance modernization work could surface situations where a rate increase or renegotiation should be considered before proceeding.
That is one of the reasons I tend to approach automation as a systems problem rather than simply asking how to make an individual task faster.
The immediate request was to improve weekly forecasting.
The larger opportunity was to create a reliable operational picture of how assignments, schedules, billing, and profitability related to one another.
Before
Account Managers manually estimated billing by client. Zenople reports had to be pulled and interpreted. Schedules, holidays, closures, and employee absences required manual consideration. When the advance work wasn't completed, Branch Managers inherited it. A meeting intended to validate the forecast became the place where the forecast was actually created, consuming 60–90 minutes of several people's time.
After
Subscribed reports were automatically ingested into structured data. Active assignments and schedules drove expected hours. Client closures, assignment dates, unpaid breaks, bill rates, shift differentials, and overtime rules were applied programmatically. Actual billing and forecast information were presented through an internal application. The remaining attendance review took approximately 10–15 minutes on Friday, and Finance could retrieve the resulting forecast without holding the recurring preparation meeting.
Understanding what people were actually doing rather than simply reproducing the existing spreadsheet.
Using spreadsheet automation to establish and validate the business logic before moving the process into a database-backed application.
Building a reliable ingestion workflow around subscribed reports when direct API access wasn't appropriate.
Turning assignments, schedules, closures, billing relationships, and other operational concepts into structured information that could be reused.
Translating business knowledge about hours, rates, shifts, closures, and overtime into repeatable calculations.
Designing the ingestion workflow, database logic, business rules, and web interface needed to turn disparate operational information into a usable business tool.
Reducing repetitive preparation and ultimately removing a recurring meeting whose primary purpose had been assembling information the system could provide automatically.
The goal wasn't to make the forecast meeting faster. It was to understand why the meeting took so long in the first place, automate the work that didn't require human judgment, and eventually remove the need for the meeting altogether.